Whether you’re a seasoned investor or a newbie entering the world of finance, understanding how to evaluate your portfolio’s return is necessary. While the easiest way to find out the returns is to just calculate them using the Extended Internal Rate of Return (XIRR) or Compound Annual Growth Rate (CAGR) method, these methods don’t consider the risk you have taken to generate your returns.
In this blog, we’ll navigate the fascinating territory of portfolio performance evaluation from a risk and return point of view and decode three golden key ratios: the Treynor, Sharpe, and Jensen ratios.
The Need for Portfolio Performance Evaluation
If you think the success of an investment portfolio solely depends on returns, you’re only seeing half picture. It’s like judging the worth of an iceberg just by its tip. The actual depth lies beneath the surface, unseen, but pivotal – the ‘Risk’.
Since the 1960s, finance gurus have developed measures to quantify and measure risk instead of just focusing on return figures. This was essential as it allowed for a better assessment of investment performance. It helped them make more informed investment decisions, ensure proper portfolio diversification, accurately compare investment managers, and benchmark against market- or industry-standard metrics.
Let’s explore these key measures – the Treynor, Sharpe, and Jensen ratios, in more detail that artfully blends risk and return into a single, comprehensive value.
What is Treynor Measure?
Treynor Measure was developed by Jack L. Treynor in 1965. This performance measurement tool uniquely applies to all investors, no matter their risk preferences.
It cleverly separates risk into two categories:
- Risk due to overall market fluctuations
- Risk due to individual security’s fluctuations.
Let’s understand Treynor Measure with an example:
Consider three portfolio managers – Alex, Bella, and Charlie. Each of them manages a portfolio with the following 10-year results:
| Manager | Average Annual Return | Beta |
| Alex | 12% | 0.95 |
| Bella | 15% | 1.1 |
| Charlie | 17% | 1.25 |
Here, Beta is like a yardstick for understanding how much a specific stock’s price might change compared to the whole market. A beta over 1.0 means the stock’s price could change more than the market as a whole. If beta is less than 1.0, it means the stock’s price might change less than the overall market.
Let’s assume that over the last 10 years, the annual return for the S&P 500 (which we’ll use as a proxy for the market portfolio) was 10%, and the average annual return on Treasury bills (which we’ll use as a good proxy for the risk-free rate) was 3%.
The Treynor Measure for the above case can then be calculated as follows:
How is the Treynor Measure Calculated?
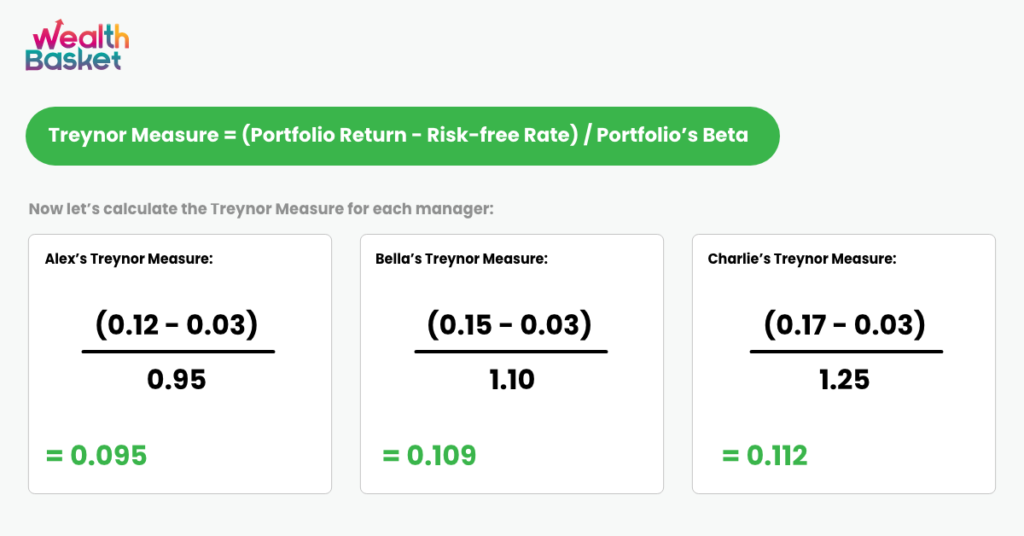
By comparing these measures, we can see that Charlie’s portfolio offers the highest return per unit of market risk, followed by Bella and Alex. Therefore, based on the Treynor Measure, Charlie’s portfolio might be seen as the most attractive option.
However, it’s essential to remember that the Treynor Measure only considers systematic risk (market risk), assuming that the investor already holds a diversified portfolio. Therefore, it’s important to consider other performance measures and factors before making investment decisions.
What is Sharpe Ratio?
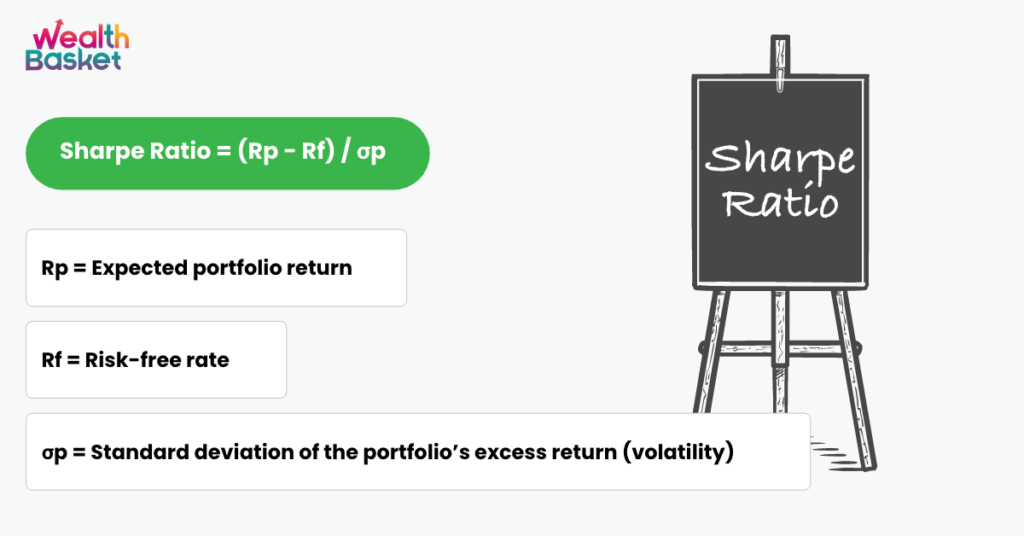
Sharpe Ratio was developed by William F Sharpe in 1966. This ratio resembles the Treynor Measure, but with one fundamental difference: it employs the standard deviation of the portfolio to measure risk rather than focusing solely on systematic risk.
It’s like having an extra magnifying glass to examine your investment, taking diversification into account. A higher Sharpe ratio means the investment provides a better return for the amount of risk which is being taken.
How is the Sharpe ratio calculated?
For example:
Let’s assume we have an investment portfolio managed by Manager A. The portfolio has an expected return (Rp) of 12% for the upcoming year. The current risk-free rate (Rf), represented by the yield on a 3-month U.S. Treasury bill, is 2%. The portfolio’s returns have a standard deviation (σp) of 10%.
Plugging these values into the Sharpe Ratio formula, we get:
Sharpe Ratio = (12% – 2%) / 10% = 1.0
This suggests that for every unit of extra risk assumed by the investor, he is expected to earn a return of 1% above the risk-free rate which he could have received by investing in bonds, FDs, etc. This ratio can be used to compare the risk-adjusted performance of different portfolios or investment strategies.
What is Jensen Measure?
Jensen Measure was developed by Michael C. Jensen in 1968. This measure helps you understand the excess return your portfolio generates over its expected return, also known as Jensen’s alpha.
Picture an investor. Mike is invested in three funds. Using the Jensen Measure, Mike found out that one fund manager did the best because, although another had the same annual return, it was expected to yield a lower return due to a lower beta. Here, the Jensen Measure helped Mike identify superior performance on a risk-adjusted basis.
How Jensen Measure or Jensen Alpha is calculated?
Let’s consider a portfolio managed by Manager A.
The Average Annual Return of the Portfolio managed by Manager A (Rp): 15%
Risk-free Rate of Return (Rf): 3%
The Portfolio’s Beta (β): 1.2
Return on the Market Index (Rm): 10%
To measure Jensen Alpha, first the portfolio’s expected return (ER) is calculated by using the CAPM formula:
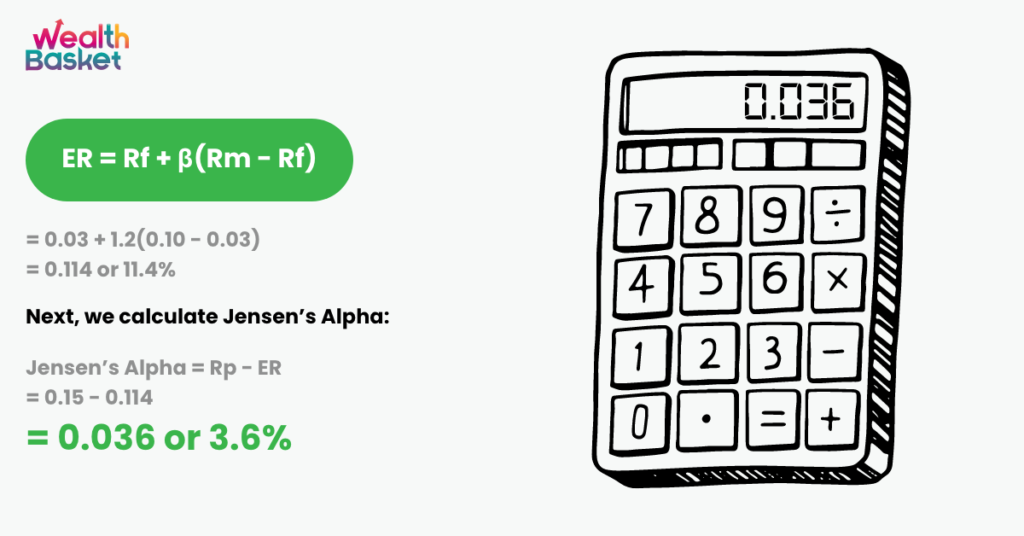
This positive alpha of 3.6% suggests that Manager A has outperformed the market on a risk-adjusted basis.
Remember, Jensen’s Alpha is a risk-adjusted measure, so it’s showing us the extra return that Manager A achieved over the expected return given the portfolio’s level of market risk (beta). So, despite the portfolio’s higher risk (beta of 1.2), Manager A has managed to generate returns higher than the market’s expectation, indicating superior management skills.
Final thoughts
These three performance measures, each with their unique approach, are vital tools for all investors. They provide insightful information to assess how effectively money has been invested.
So, the next time you find yourself evaluating your portfolio’s performance, remember to consider both the visible tip and the hidden depth – the return and the risk by using Treynor, Sharpe, and Jensen measures to your advantage.
FAQs
Portfolio performance evaluation is a process that involves assessing how well a specific investment portfolio has performed compared to its benchmarks or other similar investments.
Understanding risk-adjusted returns is crucial because it provides a more comprehensive picture of a portfolio’s performance, taking into account both the returns and the risks involved in achieving those returns.
These are performance measurement tools that integrate risk and return performance into a single value. They help investors assess the performance of portfolios or funds on a risk-adjusted basis.
The Treynor measure, also known as the reward-to-volatility ratio, calculates the portfolio’s return per unit of systematic risk. The higher the Treynor measure, the better the risk-return tradeoff.
The Sharpe ratio compares portfolio returns to the total portfolio risk (as measured by standard deviation). It helps investors understand how much excess return they are receiving for the extra volatility they endure for holding a riskier asset.
There’s no definitive answer as it depends on the investor’s individual needs and the type of portfolio. Some may prefer the Sharpe ratio for its consideration of total risk, while others may opt for the Treynor measure or Jensen’s Alpha, which factor in systematic risk only.
Portfolio diversification helps to spread risk across different types of investments. In performance evaluation, it helps in reducing the unsystematic risk, which is considered by the Sharpe ratio, but not the Treynor measure or Jensen’s Alpha.


