As 2021 ended, we compiled a report on the key moments that defined the year for the wealth management space. In our Yearly Wrap, we also look at critical global moments.
A lot has happened over the past year. The Second Wave of COVID-19, the ship that momentarily stopped world trade, the Evergrande crisis, spikes in global inflation, and a lot more. We saw life return to some form of normalcy through all these struggles. We saw the resilience of Indian entrepreneurs as we saw 44 companies enter the unicorn club in 2021.
Yearly Wrap – 2021 | Download Link
Market Indices Performance Overview
GLOBAL INDICES
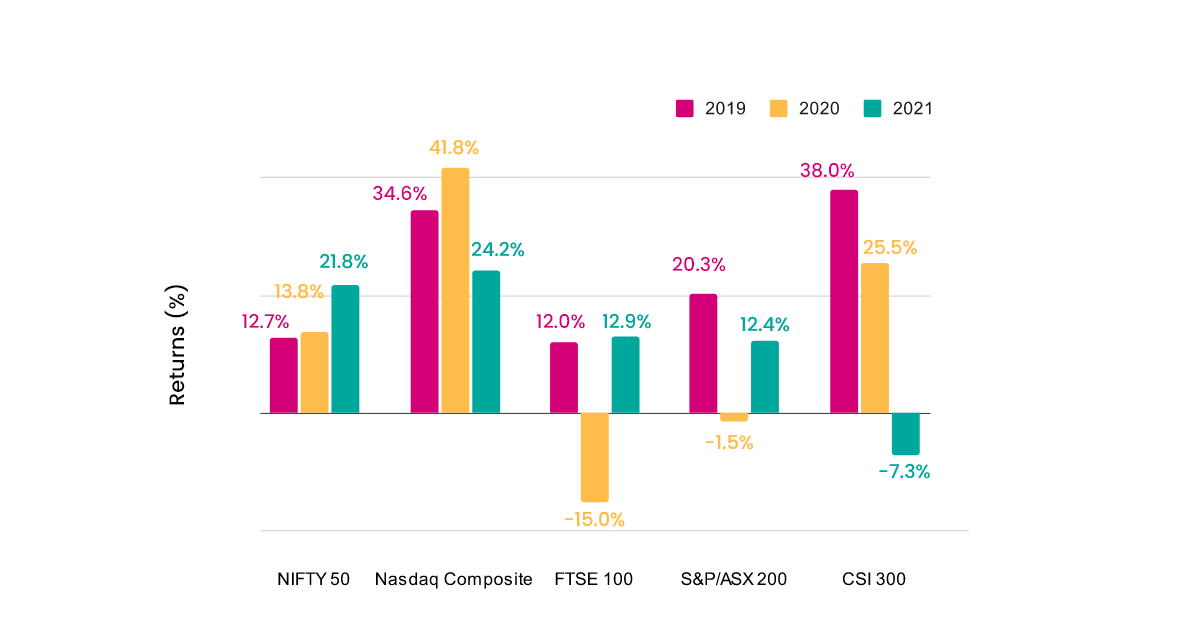
In the graph above, we compare the performance of NIFTY 50 with foreign market indices over three years of 2019-2021.
Market Indices Included:
- NIFTY 50
The NIFTY 50 is a benchmark stock market index representing the weighted average of the 50 largest companies listed on the National Stock Exchange. Hence, the index was an appropriate choice for showing the performance of the Indian stock market in general.
- Nasdaq Composite
Nasdaq Composite is a stock market index that includes all the stocks on the Nasdaq stock exchange, an America based stock exchange. To understand how the world’s leading market has been doing in the same period, we believe Nasdaq Composite was an appropriate pick.
The US economy accounted for 15.83% of the global GDP in 2020.
- FTSE 100
Financial Times Stock Exchange Index (FTSE), informally known as ‘footsie’, is an index of the 100 largest companies by market capitalisation on the London Stock Exchange (LSE). The UK has been in the headlines for its decision to leave the European Union. Thus, it would be interesting to take note of the performance of a market dealing with a breakaway from a major player in international trade, the European Union.
The UK has been a major player in the global economy, contributing 2.24% of the global GDP in 2020.
- S&P/ASX 200
The S&P/ASX 200 is a market capitalization-weighted and float-adjusted stock market index of the Australian Securities Exchange. The index maintained by Standard and Poors reflects the performance of Australian markets. Australia has a high-performing economy with only 0.3% of the world’s population; Australia accounted for 1.01% of global GDP in 2020.
- CSI 300
CSI 300 is a market capitalization-weighted stock market index designed to mirror the performance of the Shanghai Stock Exchange and the Shenzhen Stock Exchange. This index gives a decent insight into the Chinese markets. When it comes to GDP growth numbers, China actively competes with India. China is also a major player in the world economy, contributing 18.33% to the global GDP in 2020.
Source: Global GDP shares from Statista, Australia population figure from AusTrade.Gov.in
Our Observations:
- Chinese market underperformance was mainly on the back of policy-related implications across China and globally, and also the Evergrande crisis
- Political clarity after the election of US President Joe Biden aided the US market outperformance
NIFTY SECTORAL INDICES
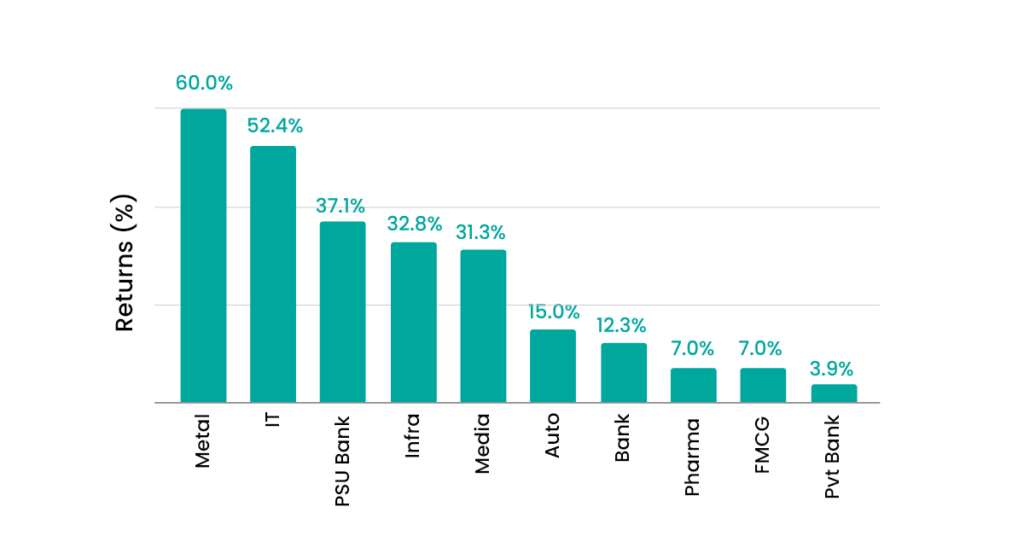
For gaining a deeper insight into the domestic markets, we look at various NIFTY sectoral indices.
Key Performers
| Sector | Returns (%) | Causes |
| Metals | 60 | Global demand push |
| IT | 52.4 | Focus on globalisation |
| Infrastructure | 32.8 | Demand push supported by low-interest rates and favourable policies |
| Media | 31.3 | Benefited from unlocking theme and viewership increase as people spent more time at home |
Market Capitalization Gained by the Top Corporate Houses in India
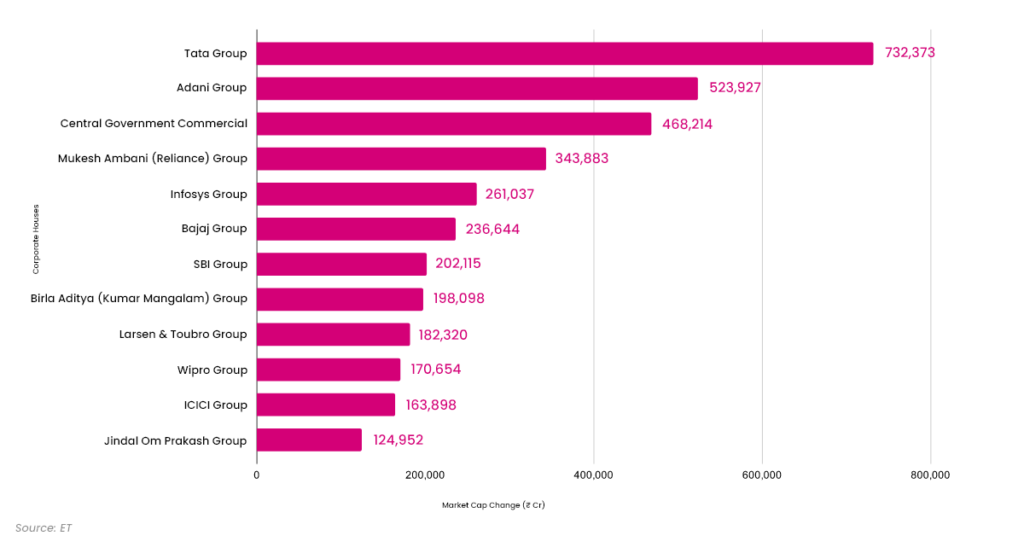
This section looks at some of the major players in the Indian markets. These corporate houses have existed for many years and have played a vital role in the country’s development.
The current top spot holder, Tata Group, is one of the oldest corporate houses in the country. Tata Group has a presence in steel, automobiles, aviation, and even IT. They also have a considerable presence in tourism & travel, and financial services. At the same time, they are one of the most respected corporate houses in the country.
At the second spot, we have Adani Group. Last year, Adani Group took over the management of Mumbai Airport. They have also been increasing the number of ports in manages across the country and the world. Adani Wilmar, another branch of the Adani Group, is also soon coming out with its IPO. Adani Green Energy is another promising endeavour that is already a major figure in India’s renewable energy market.
With LIC going public, we might see the Indian government top this list in 2022. Indian government’s position would depend heavily on the asset monetization plans announced during the Union Budget, 2022.
Which corporate house will take the top place on the list next year? Only time will tell.
Asset Class Performance Overview
The table below highlights the performance of 8 asset classes over a period of CY16-21, in order of performance from highest to lowest. The variation in performance across asset classes emphasises building a diversified portfolio against predicting the next best performing asset class for any investor.
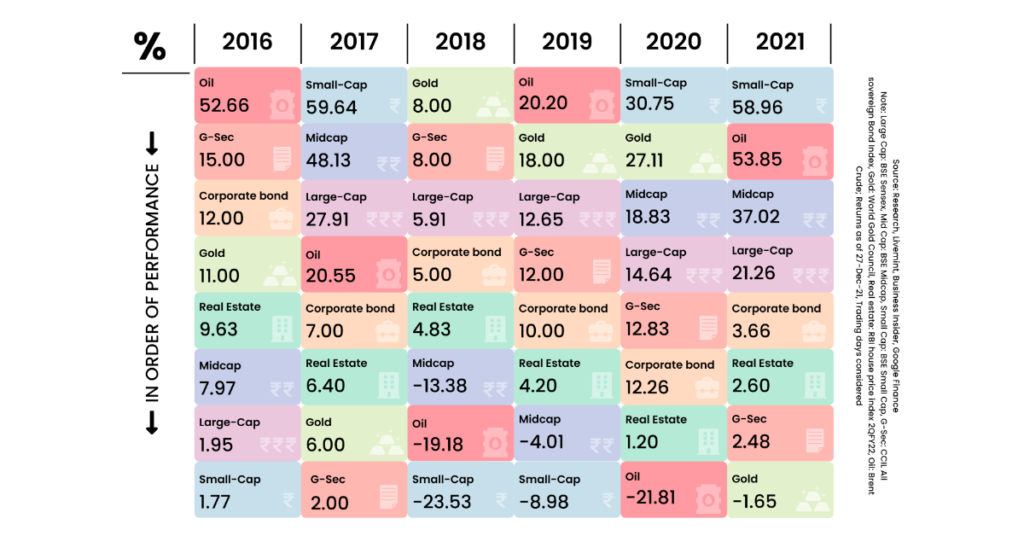
Note: Large Cap: BSE Sensex, Mid Cap: BSE Midcap, Small Cap: BSE Small Cap, G-Sec: CCIL All sovereign Bond Index, Gold: World Gold Council, Real estate: RBI house price index 2QFY22, Oil: Brent Crude; Returns as of 27-Dec-21, Trading days considered
A Few Key Observations:
- Small-Cap has outperformed other asset classes 3 out of 6 times over the past six years
- However, Small-Cap has also been the worst performer for the other 3 years
- Diversification across equities based on capitalisation offers considerable chances of outperforming any single asset class
- “Safe” asset classes like G-Sec, real estate, gold and corporate bonds assist in stabilising overall portfolio returns
-
Oil as a commodity has shown volatility in
performance, particularly over CY20-21 owing to demand
pressures on the back of lockdown and unlocking across
economies
- Fact: Petrol and Diesel prices for end consumers increased by ~20% from Jan-Dec in 2021, across India
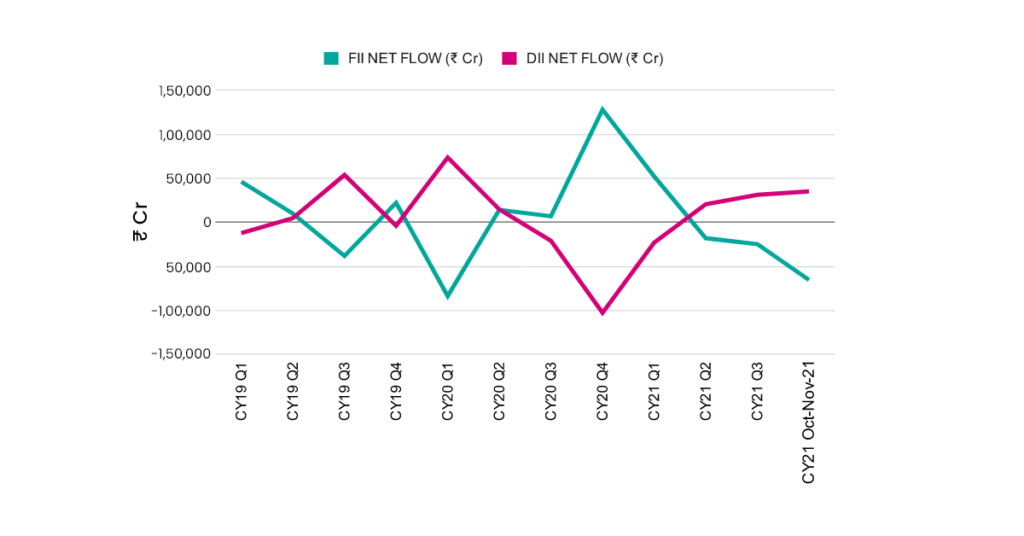
Tracking the Money Flow
FII & DII Trading Activity
The below chart reflects the net FII, and DII cash flows into the markets over 2019 to 2021. Starting CY21 Q2, FIIs have been net sellers in the Indian market, while DIIs have turned net buyers.
2021:Year of the Ox Bull…
Startups in India essentially captured the bullish spirit of the Ox year. Just one year into the 2020s, India has eclipsed the previous decade of 2011-20 in terms of the number of unicorns formed.
44 Indian startups joined the unicorn club this year compared to 37 startups that joined in the 2011-20 decade.
Indian startups raised ₹46,045 crores through IPOs, nearly 70% of the total capital raised through IPOs.
As of December 22nd, fintech companies raised ₹79,201 crores in 2021.
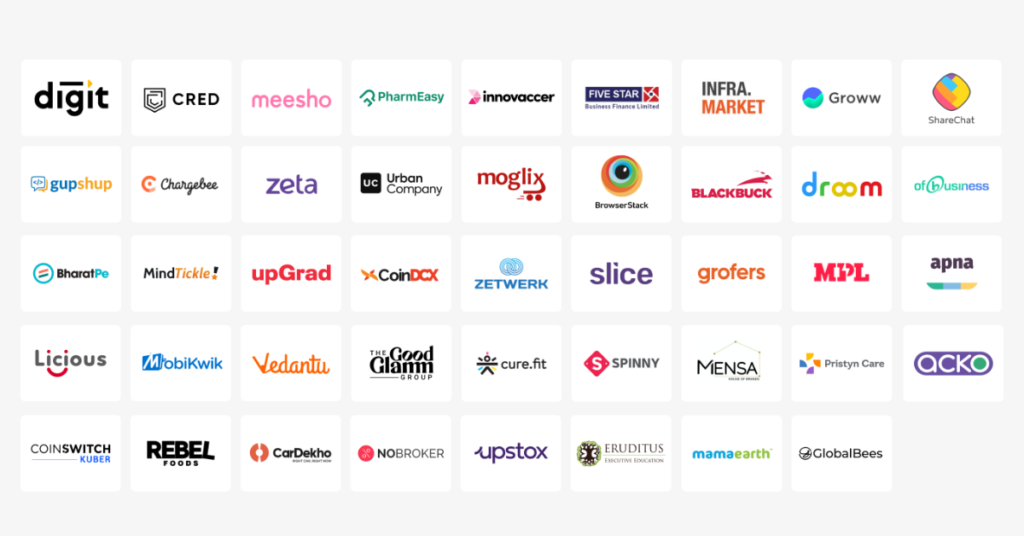
(Conversions of $ to ₹ as of 29/12/2021)
WealthDesk announced the Unified Wealth Interface (UWI) Vision
UWI is an internet-scale wealth management ecosystem on top of broking powered by the WealthDesk Platform and built on the Embedded WealthDesk Gateway (EWG).

What is EWG?
Embedded WealthDesk Gateway makes it easy for investors to trade in stocks, ETFs & WealthBaskets on a website or app with their broking account in a seamless way.
WealthDesk is onboarding leading SEBI RIAs, Research analysts, AMCs, media sites onto the Unified Wealth interface to create innovative Wealth and Investment solutions powered by a single interface EWG which aggregates all Brokers on the transactions side for stocks, ETFs and WealthBaskets. Watch out for exciting updates in this space as Retail Wealth Management takes internet-scale reach through UWI.
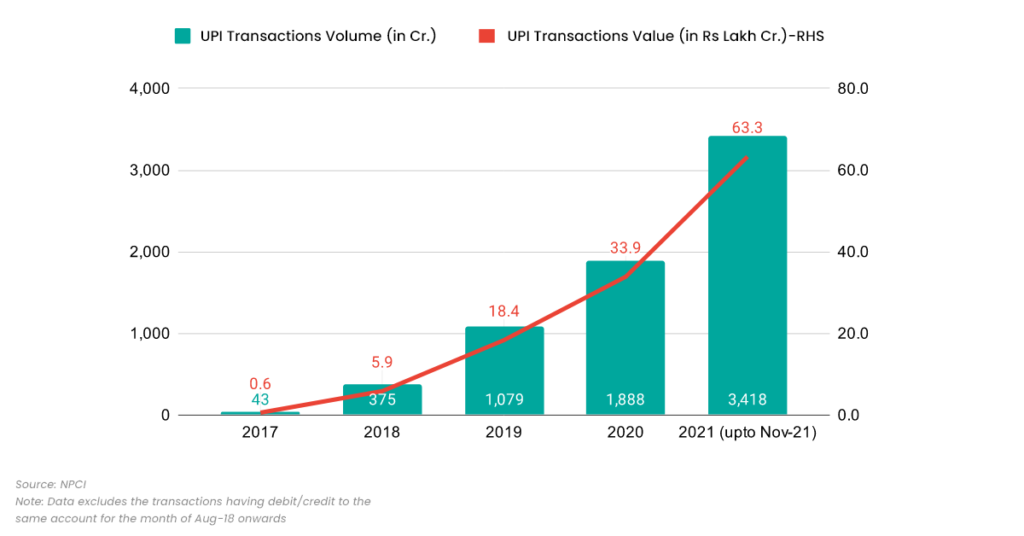
UPI Performance was Outstanding, Could UWI see similar traction?
The Unified Payment Interface (UPI) significantly increased the usage of digital payments in India, and WealthDesk is pioneering the same through UWI for the asset and wealth management ecosystem on top of broking/transaction platforms.
The impact a unified system like UWI could have on broking wealth and asset management could be similar to UPI’s impact on digital payments.
And that’s a Wrap!

Please download the complete copy of our Yearly Wrap of 2021 and share it with your peers if you like it!