
×


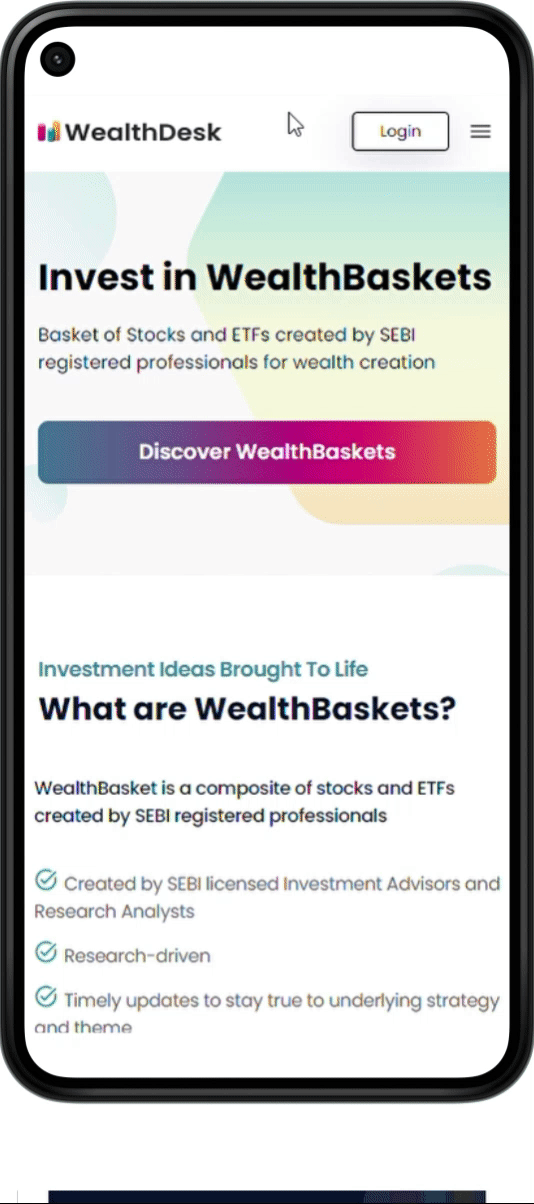
WealthBasket is a composite of stocks and ETFs created by SEBI registered professionals

Explore from the diversified collection of WealthBaskets
Subscribe to a WealthBasket and invest with your broking account
Track your WealthBaskets with regular updates

You have just started your investment journey and confused which stocks or ETFs to invest in. Begin your investment journey with WealthBaskets.

You have set a goal for yourself and are looking for the right investments to achieve them. With WealthBaskets, you can own the underlying stocks and ETFs.

You had a bad experience investing in stocks earlier? Start Over! This time invest in WealthBaskets created by SEBI registered professionals.

You can invest in thematic and sectoral stock and ETF baskets that take advantage of market trends. Diversify your portfolio with WealthBaskets.
WealthBaskets are baskets of stocks and ETFs curated using intelligent and research-backed investment strategies or themes.
WealthBaskets are curated by Share.Market Research arm.
• Regular rebalancing updates to ensure the WealthBasket
continues to optimally reflect the latest version of an
underlying research/investment methodology
•
Diversification benefits to protect against market
volatility
• No hidden costs
• Stocks and ETFs
reside in your Demat account
• No lock-in period
•
Receive dividends, if any, directly in your bank account
• Direct ownership – All the underlying
stocks and ETFs that you invest through a WealthBasket
sit in your Demat account
• Completely liquid –
There is no lock-in involved. You can exit anytime
• Transparency –
As the stocks and ETFs reside in your Demat account,
there is complete visibility of what you hold
Disclaimer: Investing in markets has its associated risks, so you
should invest as per your risk appetite and investment
objectives.
To invest in WealthBasket, you need an active trading and demat account with Share.Market. Once your account is activated with Share.Market, you can purchase WealthBasket based on your choice.
No, you need to create your trading and demat account with Share.Market to purchase WealthBaskets.
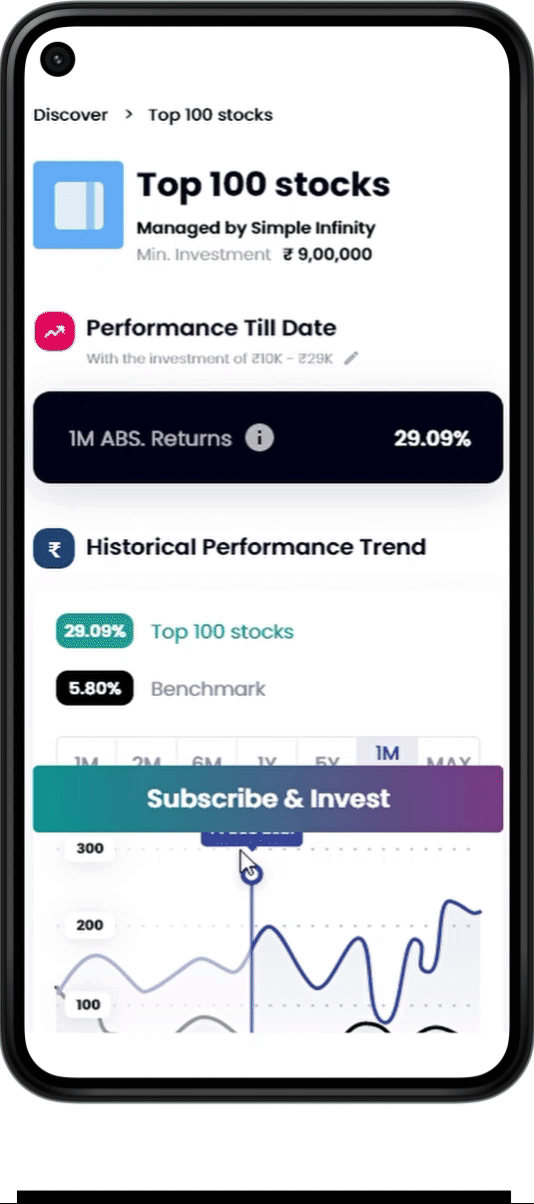
The minimum investment amount varies for different WealthBaskets. The minimum investment amount is listed on the details page of the relevant WealthBasket on Share.Market platform.
You don’t have to pay any entry fee for most
WealthBaskets. However, there may be a few curators who
charge a subscription fee for WealthBaskets. You can see
the subscription charges for WealthBaskets, if
applicable, on the details page of the relevant
WealthBasket.
You don’t have to pay an exit
fee for any WealthBasket.
Note:
You may incur transactional charges for entry, exit, and
rebalancing of your WealthBasket.
Currently, WealthBaskets span equities and ETF asset classes.
Yes, you may get dividends if the stocks in your
WealthBasket are providing them. Dividends will be
directly credited to your bank account. You can track
the paid-out dividends in your performance report on
Share.Market application.
Note:
The dividend gains in your WealthBasket are a part of
the realised gains.
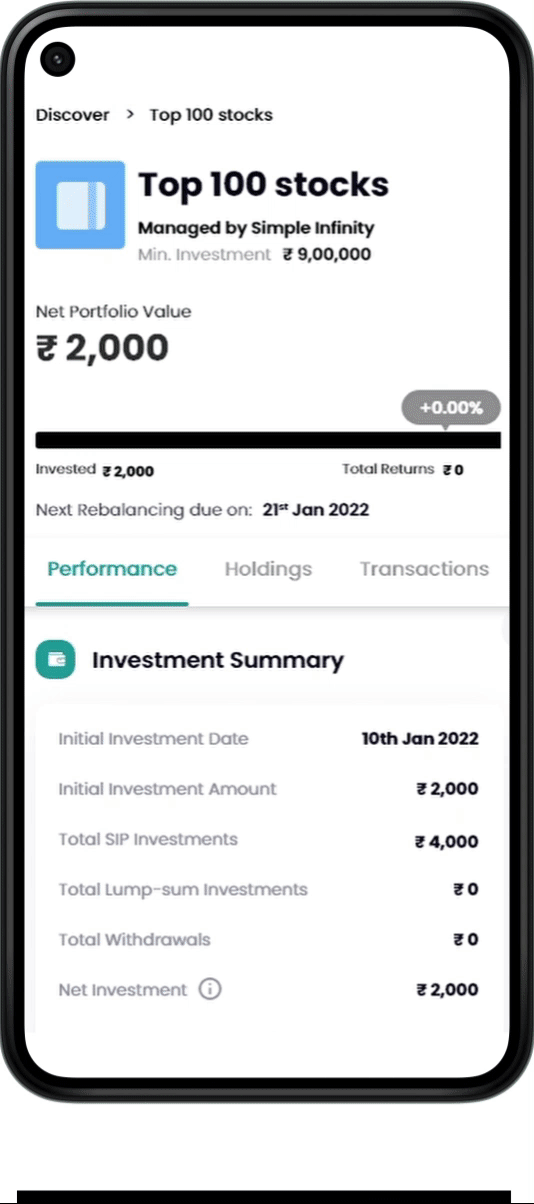
You can track your WealthBasket investments on the ‘My Portfolio’ page once you are logged in to the Share.Market app. Here, you can view the overall performance of your WealthBasket investments and the WealthBaskets individually.
You will receive notifications around errors, rejections, rebalancing notifications, etc., via e-mail and push notifications. You can also view the notifications by clicking on the bell icon on the top navigation bar, which you will see once you are logged in to the Share.Market platform.
To increase investment in a WealthBasket, you need to click on the ‘My Portfolio’ tab on Share.Market platform and head to the particular WealthBasket in the ‘WealthBasket’ section. Click on the WealthBasket you want to invest an additional amount in, select ‘My Investment’, enter the investment amount and press the ‘Invest More’ button. After this, you will be asked to confirm the investment. Once confirmed, press the ‘Place’ button.
Unsuccessful orders rejected by the broker or the exchange are shown as rejected orders. You are requested to retry the rejected orders. You can retry the rejected order by heading to the ‘Pending Actions’ tab and scrolling to the ‘Rejected Orders’ section. Here, click on ‘Approve’ to retry the rejected orders. After this, you will be asked to confirm the orders. Once approved, press the ‘Place’ button.
WealthBasket curators rebalance WealthBasket
constituents from time to time based on their investment
themes or strategies. They make recommendations to sell
and buy some or all holdings to better the WealthBasket
performance. Once you accept the recommendations, the
sell orders will be carried out first. The sale proceeds
from that will then be used to buy the recommended
shares.
Note: You will receive
notifications for WealthBasket recommendations through
emails and push notifications.
Rebalancing frequency varies depending on the investment strategies of the WealthBasket.
It is recommended to accept the rebalancing changes so that your WealthBasket investment continues to reflect the latest version of an underlying research/investment methodology. However, the final decision is yours. You may accept or reject the rebalancing changes.
Follow these steps to rebalance your WealthBasket:
•
Tap the WealthBasket notification. This will take you to
the WealthBasket page in the app.
• Here you will
see all the rebalance now pop up as a notification click
on that.
• Confirm the rebalance (if you agree).
Tap the ‘Approve’ button.
• Double-check and place
the order. A confirmation screen will appear. Tap the
‘Place’ button to execute the rebalance.
To partially withdraw funds head over to Share.Market
platform:
1. Go to
‘My Investments’ and select the
WealthBasket you want to make a partial withdrawal
from.
2. Tap the
‘More Actions’ tab located beside
‘Current Value’.
3. Select
‘Withdraw’ from the dropdown menu.
4.
Enter the amount you wish to withdraw and tap
Confirm.
5. Tap
Withdraw and authorize the trades using
your TPIN if you have not enabled
DDPI.
To exit your WealthBasket, head over to Share.Market
platform:
1. Go to
‘My Investments’ and select the
WealthBasket that you want to exit from.
2.
Tap ‘More Actions’ beside the
‘Current Value’ option.
3.
Select ‘Withdraw’ from the dropdown
menu.
4. Choose ‘Full Amount/Partial Amount’
in the
Type of Withdrawal
section.
5. Tap
Withdraw.
Note:
You will have to authorize sell transactions using your
TPIN if you haven’t enabled Demat Debit and Pledge
Instruction (DDPI).
Get investment insights by our WealthBasket Curators, major news highlights, some fun facts and a lot more, delivered to your inbox
Investments in securities are subject to market risks. Read all the related documents or product details carefully before investing. Wealth Technology & Services Private Limited ("WealthDesk") is a 100% subsidiary of PhonePe Wealth Broking Pvt Ltd. Investments in WealthBaskets are subject to the Terms of Service. https://share.market/terms-conditions

WealthDesk is a platform that lets you invest in systematic, modern investment products called WealthBasket.


